Adjusted R2 / Adjusted R-Squared


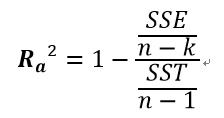
- 當變數的數目p越多,調整R平方的值會越小
- 以及當抽樣的樣本數越多,調整R平方的值會越大
- 調整R平方會偏好
- 取得更多的樣本
- 放入太多變數做參數估計給予懲罰


| R-squared | Adjusted R-squared |
|---|---|
| coefficient of determination | |
| a statistical analysis tool used to predict the future outcome of an investment and how closely it aligns to a single measured model | compares the correlation of the investment to several measured models |
| The lower the value of the R2 the less the two variables correlate to one another | |
| gives the percentage of explained variation as if all independent variables in the model affect the dependent variable | gives the percentage of variation explained by only those independent variables that, in reality, affect the dependent variable |
| assumes every independent variable—benchmark—in the model explains the variation in the dependent variable—mutual fund or portfolio | |
| a modified version of R2 for the number of predictors in a model | |
| R-squared supposes that every independent variable in the model explains the variation in the dependent variable | |
| cannot verify whether the coefficient ballpark figure and its predictions are prejudiced | |
| compares the descriptive power of regression models—two or more variables—that include a diverse number of independent variables—known as a predictor. | |
- R2 shows how well terms (data points) fit a curve or line.
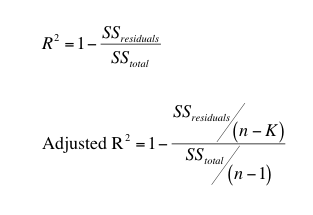
Adjusted R2 also indicates how well terms fit a curve or line, but adjusts for the number of terms in a model.
- If you add more and more useless variables to a model, adjusted r-squared will decrease.
- If you add more useful variables, adjusted r-squared will increase.
- Adjusted R2 will always be less than or equal to R2.
You only need R2 when working with samples.
- In other words, R2 isn’t necessary when you have data from an entire population.
Meaning of Adjusted R2
- Both R2 and the adjusted R2 give you an idea of how many data points fall within the line of the regression equation.
- However, there is one main difference between R2 and the adjusted R2:
- R2 assumes that every single variable explains the variation in the dependent variable.
- The adjusted R2 tells you the percentage of variation explained by only the independent variables that actually affect the dependent variable.
Problems with R2 that are corrected with an adjusted R2
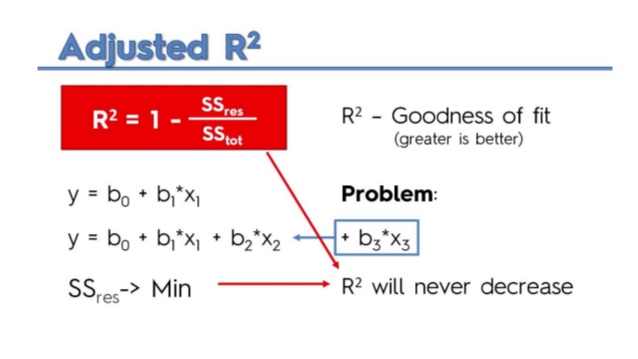
- R2 increases with every predictor added to a model. As R2 always increases and never decreases, it can appear to be a better fit with the more terms you add to the model. This can be completely misleading.
- Similarly, if your model has too many terms and too many high-order polynomials you can run into the problem of over-fitting the data.
- When you over-fit data, a misleadingly high R2 value can lead to misleading projections.