• Begin to Learn R
  • Data Analysis
  • Introduction R
  • Data Input & Output
    • Data Input 匯入資料
    • Data Output 輸出資料
    • Database Input 讀取資料庫
    • Datasets
  • Data Wrangling
    • Recode
    • Add a column
    • Factor
    • Grouping by date range
    • Reshaping Data
      • Reshaping: Long to Wide dcast(){reshape2}
      • Reshaping: Wide to Long melt(){reshape2}
    • Sorting Results
    • String Manipulation
    • Subset
    • Summaries by Subgroups {plyr}
  • EDA - Exploratory Data Analysis
    • Data Exploratory
      • Variable Identification
      • Univariate Analysis
        • IQR Interquartile Range
        • Frequency Table (Chart)
        • Frequency Distribution Table
        • Cumulative Frequency Distribution Table
        • Stemplot
      • Bi-variate Analysis
      • Missing values treatment
      • Outlier treatment
    • Feature Engineering
      • Variable transformation
      • Variable creation
  • Data Analysis
    • R Data Analysis
      • Graphical Data Analysis
      • Factor Analysis
      • PCA - Principal Components Analysis
      • Decision Trees
      • Random Forest
      • Clustering
      • Classification
      • SVM - Support Vector Machines
      • Naïve Bayes Classification
      • Bayesian Statistics
      • Bayesian Methods
      • Bayesian Network
      • Bayesian Networks Inference
      • Bayesian Network Applications
      • Time-series
    • R Statistics 統計
      • Descriptive Statistics
        • Mean
        • Mode
        • Median
        • IQR Interquartile Range
        • 5-number summary
        • Variance
        • Standard Deviation
        • Standard error
      • Inferential statistics
        • Expected Value
        • Hypothesis Testing
        • T-tests
        • ANOVA
        • Chi-Square Test
      • Linear Regression
        • Linear Models
      • Nonlinear Regression Analysis
        • Logistic Regression
        • Generalized linear models (GLMs)
        • Maximum Likelihood Estimation (MLE)
        • Generalized Additive Models(GAM)
      • Survival Analysis
      • Distribution
        • Normal Distribution
        • Non Normal Distribution
        • Binomial Distribution
        • Poisson Distribution
    • Machine Learning
      • Unsupervised learning
      • Supervised learning
      • Reinforcement Learning
      • Support Vector Machine 支持向量機
    • Structural Change and Anomalies Detection
    • Crawler 網頁解析爬蟲
    • Binary Classification metrics
  • Data Communication 溝通資料
  • Data Visualization
  • Data Prediction (Modeling)
  • Case & Code
  • Application_R
  • Finance R
  • Genomics R
  • Clinical Research
  • Commerce 商業
  • R Basic
  • R Basic
    • Command
      • {base}
      • {stats}
    • Syntax
    • Arguments
    • Packages
  • Install & Setting
    • R install
      • R install_Ubuntu18
    • R setting
    • Environment 環境空間
  • Data
    • Data Structures
      • Data Frame 資料框架
        • Create/Input
        • Reference Elements
        • Modify
        • Operations
        • Output
        • Function
        • Example
      • List 列表
        • Create/Input
        • Reference Elements
        • Modify
        • Operations
        • Output
        • Function
        • Example
      • Vectors 向量 (1維)
        • Create/Input
        • Reference Elements
        • Modify
        • Operations
        • Output
        • Function
        • Example
      • Matrices 矩陣 (2維)
        • Create/Input
        • Reference Elements
        • Modify
        • Operations
        • Output
        • Function
        • Example
      • Array 陣列 (多維)
        • Create/Input
        • Reference Elements
        • Modify
        • Operations
        • Output
        • Function
        • Example
      • xts: time series data
        • Create/Input
        • Reference Elements
        • Modify
        • Operations
        • Output
        • Function
        • Example
    • Data Types
      • Numeric
        • Operations
        • Function
        • Example
      • Logical
        • Operations
        • Function
        • Example
      • Character 文字型別
        • Operations 文字操作
          • Create 建立
          • Length 量測長度
          • Case 大小寫
          • Space 空格
          • Output 格式化輸出
          • Capture 擷取
          • Date 日期時間
          • Split 分隔
          • Position 位置
          • Replace 取代
          • Regular Expression 正規表達
          • Apply to Array 應用文字處理函數至陣列
        • Function
        • Example
      • Factor 因子
        • Operations
        • Function
        • Example
      • Dates
        • Operations
        • Function
        • Example
      • Missing Data
        • Operations
        • Function
        • Example
  • Function
    • Date
  • Variable 變數
    • Discrete Variables
    • Continuous Variables
    • Quantitative Variables
    • Qualitative Variables
    • Categorical Variable
  • Loop
    • if 判斷式
    • switch 單選
    • while-loop
    • for-loop
    • repeat-loop
    • break loop
    • next loop
  • Graphics
    • Basic Graphics
      • Bar Chart
      • Histogram
      • Boxplot
    • Advanced Graphics
    • Package Graphics
      • {ggplot2} a-z
      • {ggplot2} option a-z
      • {graphics} a-z
      • {graphics} arguments a-z
      • {lattice} a-z
    • Save Graphs to Files
  • Issue 問題
    • Date
    • Time
    • Season
    • Trend
  • Shiny
    • Shiny Introduction
    • Build shiny applications
  • Learning_R
    • Learning Map R
  • R Tools
  • Tools
    • R Command A-Z
    • Cheat Sheet
    • How R
Powered by GitBook

Graphics

Graphics

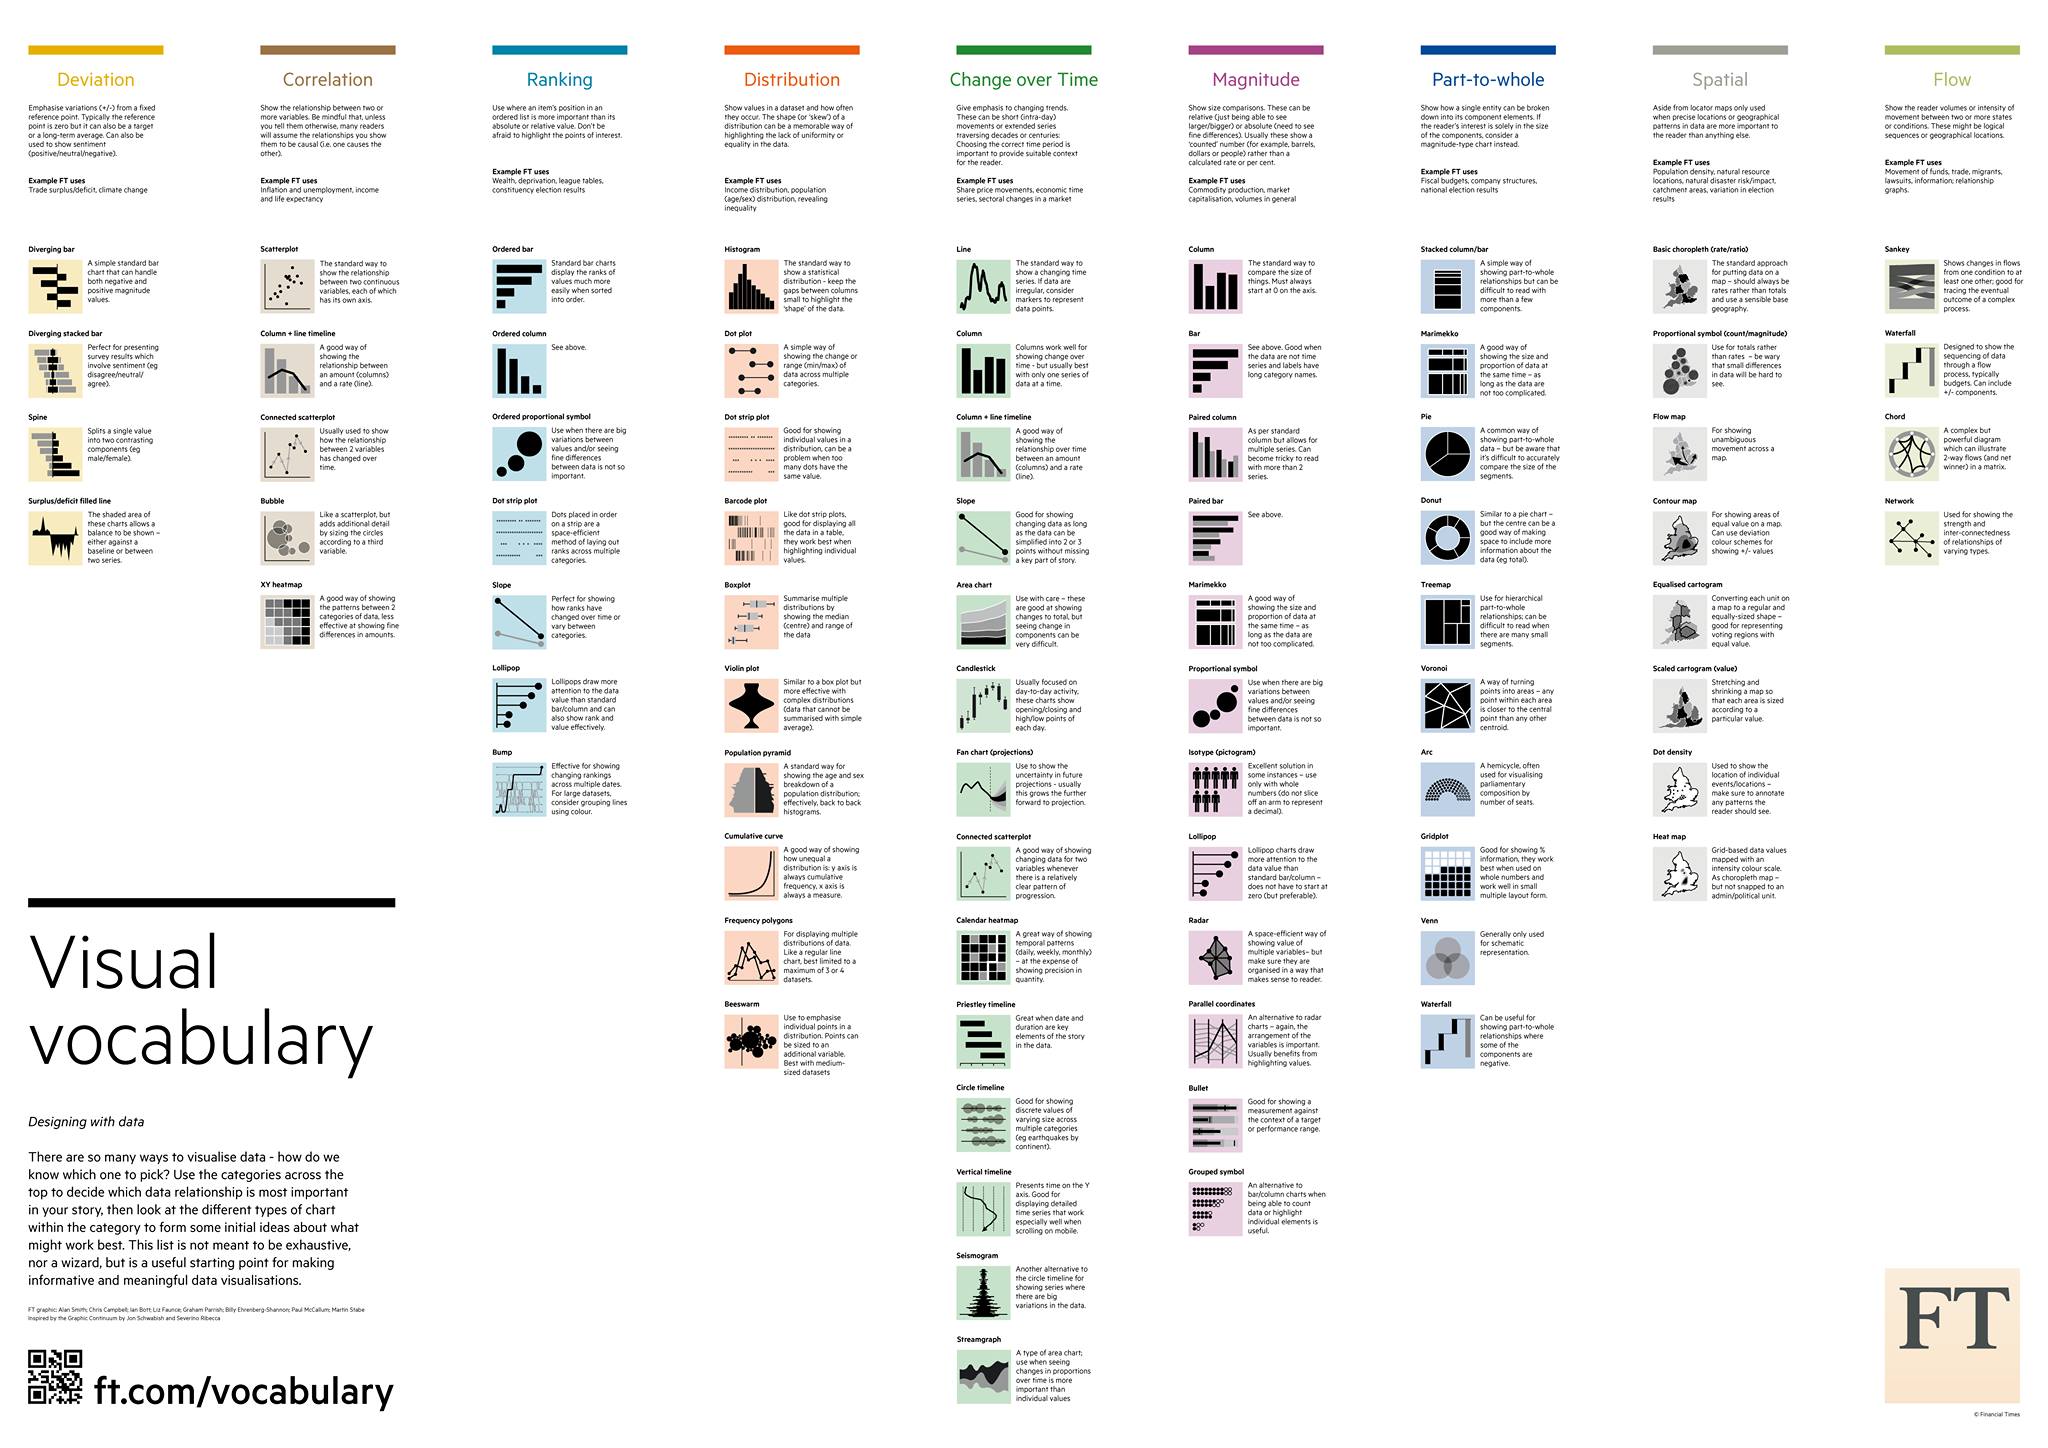
from: Visual Vocabulary


Reference:

  • R plot 繪圖函數 - G. T. Wang
  • R ggplot2 教學:圖層式繪圖 - G. T. Wang
  • R ggplot2 教學:基本概念與 qplot 函數 - G. T. Wang
  • R 資料探索與基本繪圖 - G. T. Wang
  • R Graphical Models Tutorial for Beginners - DataFlair
  • Top Graphical Models Applications in Real World - DataFlair
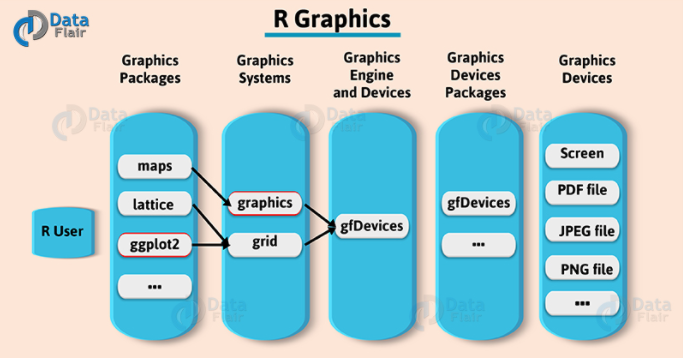
  • Graphical Data Analysis With R Programming Language - DataFlair

results matching ""

    No results matching ""