Basic Graphics/Boxplot
Boxplot & Outliers
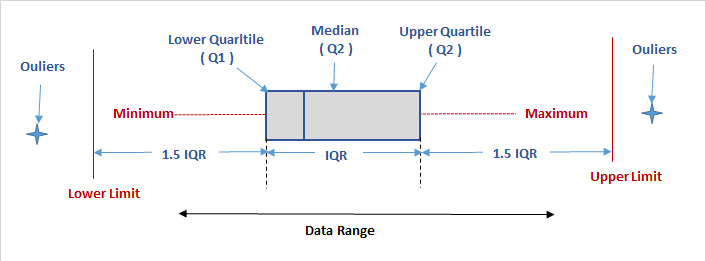
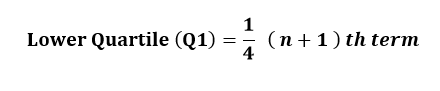
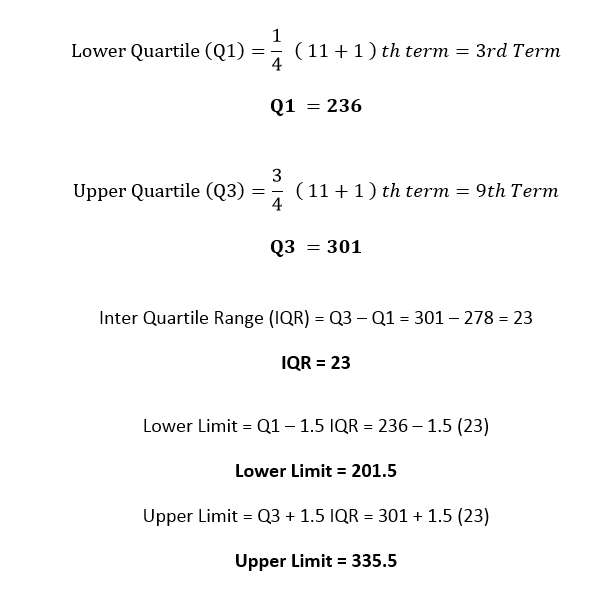
Q1 Lower quartile:
- the median of the lower half of the data set
- the median of the lower half of the data set
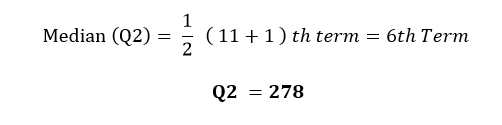
Q2 Median:
the middle value of the data set

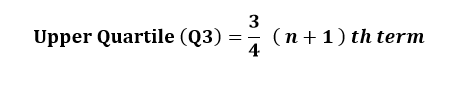
Q3 Upper quartile:
- the median of the upper half of the data set
- the median of the upper half of the data set
IQR Interquartile range:
- the spread of the middle 50% of the data values
- Interquartile Range (IQR) = Upper Quartile (Q3) – Lower Quartile (Q1)
- IQR = Q3 – Q1
Lower Limit = Q1 – 1.5 IQR.
Upper Limit = Q3 + 1.5 IQR
Outliers
- any value that will be more than the upper limit or lesser than the lower limit will be the outliers.
- Only the data that lies within Lower and upper limit are statistically considered normal and thus can be used for further observation or study
Example
Let the data range be 199, 201, 236, 269,271,278,283,291, 301, 303, and 341
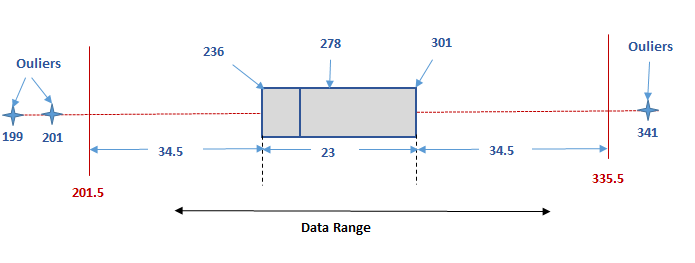
Therefore n = 11
Conclusion
- any range above 333.5 or below 201.5 are outliers.
- outliers are 199, 201 and 341
- These 3 values which lies on either of the extremes can be considered abnormal and should be discarded from the entire series so that any analysis made on this series is not influenced by these extreme values.
- outliers are 199, 201 and 341
- the data series that should be considered for further observation or study after discarding the outliers are as below:
- 236, 269,271,278,283,291, 301, 303
- any range above 333.5 or below 201.5 are outliers.
Reference
- Box plot - Wikipedia
- Box Plot Diagram to Identify Outliers
- Box Plot (Box and Whiskers): How to Read One & How to Make One in Excel, TI-83, SPSS - Statistics How To